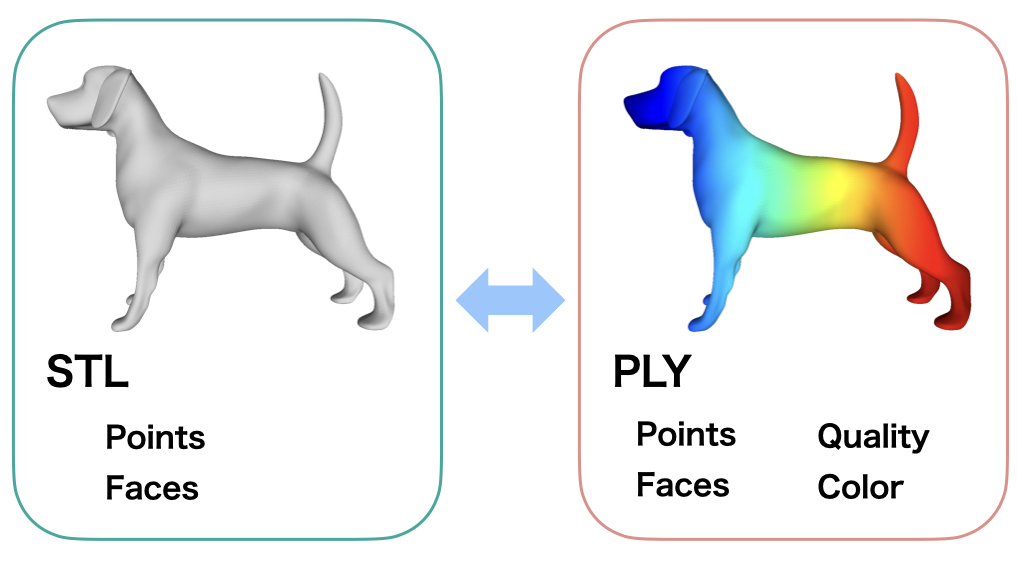
PLY file is Polygon File Format that contents 3D-position and quality.
PLY can be used to visualized numerical data on a 3D model using color map.
- Structure of PLY files
- Write a PLY file with own data
1 Structure of a PLY file
PLY contains
- Header
- Points and Values(Color, Quality)
- Point Index of Triangles and Values(Color, Quality)
As an example, in the wrist CT, calculate the surface distance of the bone1 from the bone2.
The bone1 surface is color-mapped with the surface distance.
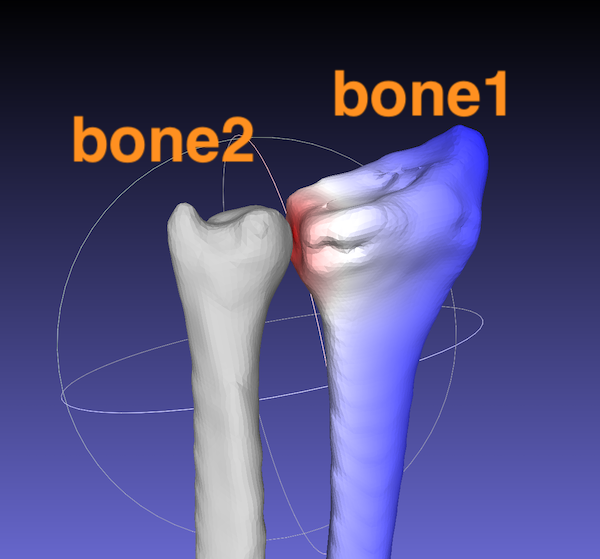
Red represents small distance and Blue represents large distance.
The bone1 surface data contains
the value “distance”
This value is visualized with color map.
The data of the value and color are not saved in STL format, but saved in PLY format.
Here, save the surface PLY data in ASCII format and opened with text editor.
format ascii 1.0
comment VCGLIB generated
element vertex 23866
property float x
property float y
property float z
property uchar red
property uchar green
property uchar blue
property uchar alpha
property float quality
element face 23802
property list uchar int vertex_indices
property uchar red
property uchar green
property uchar blue
property uchar alpha
end_header
-126.7488 -31.52647 -816.0538 0 0 255 255 120.3788
-126.4972 -31.27693 -815.8904 0 0 255 255 120.3788
-126.4011 -31.52209 -816.0673 0 0 255 255 120.3788
-127.0804 -31.64915 -816.0208 0 0 255 255 120.3788
-127.0749 -31.37141 -815.8459 0 0 255 255 120.3788
-127.4964 -31.62467 -815.8231 0 0 255 255 120.3788
-123.8012 -32.81599 -816.433 0 0 255 255 120.3788
・
・
・
3 13771 13847 13851 255 255 255 255
3 13776 13771 13851 255 255 255 255
3 13777 13776 13852 255 255 255 255
3 13776 13851 13852 255 255 255 255
3 13853 13852 13854 255 255 255 255
3 13853 13778 13852 255 255 255 255
3 13778 13777 13852 255 255 255 255
3 13778 13853 13780 255 255 255 255
・
・
・
・
“Header and Numebers” Structure.
The numbers consist of 2 parts.
Vertex part and face part.
“element vertex” is the number of points.
“element face” is the number of the faces
Pick up the first line.
-126.7488 -31.52647 -816.0538 0 0 255 255 120.3788
This line consists of
property float x
property float y
property float z
property uchar red
property uchar green
property uchar blue
property uchar alpha
property float quality
-126.7488 -31.52647 -816.0538
is the point coordinate (x, y, z)
0 0 255 255
is color(rgba: red, green, blue, alpha-transparent)
120.3788
is quality (distance in this case)
float quality = values of the points(vertices)
The numbers
3 13771 13847 13851 255 255 255 255
3 13776 13771 13851 255 255 255 255
3 13777 13776 13852 255 255 255 255
3 13776 13851 13852 255 255 255 255
3 13853 13852 13854 255 255 255 255
3 13853 13778 13852 255 255 255 255
3 13778 13777 13852 255 255 255 255
3 13778 13853 13780 255 255 255 255
are
property list uchar int vertex_indices
property uchar red
property uchar green
property uchar blue
property uchar alpha
The first number
“3”
means the face consists of 3 points.
(triangle mesh)
13771 13847 13851
mean indices of the 3 points
255 255 255 255
is color rgba(red, green, blue, alpha-transparent)
All color indices of this model are 255 suggesting that the face color is white.
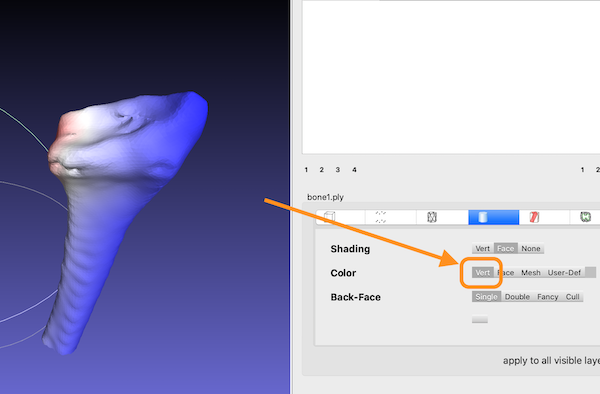
Vertices have different colors.
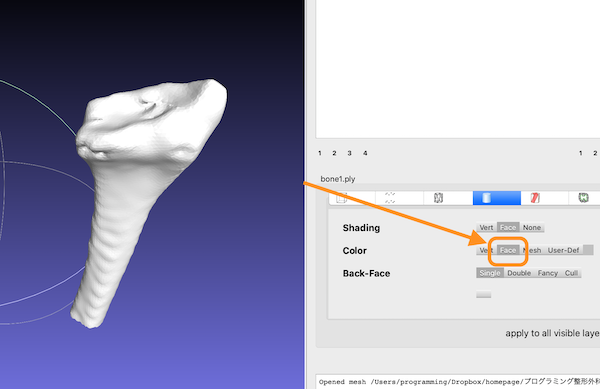
All faces are white.
2 Construct PLY data
By reconstructing these structure, PLY files can be written by adding qualities on point data.
Visualization of quality data is useful in data science.
Process of writing PLY file
Extract points and faces from STL file
↓
Calculate the value for each point
↓
add the value data on the points(vertices)
↓
write header, points, surface data.
(1)Extract points and faces from the stl file
As an example, a dog stl file is downloaded.
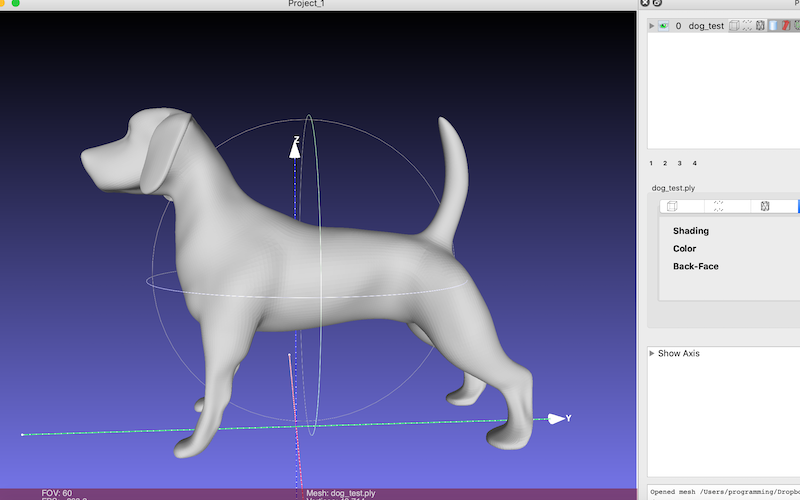
“numpy-stl” library is used to handle with the stl file.
import numpy as np
from stl import mesh

surface = mesh.Mesh.from_file('dog.stl')
point_list = surface.points.reshape([-1, 3])
print(len(point_list))
# 298272
print(point_list)
[[-2.6301 6.9699 15.6182]
[-2.6115 7.205 15.5955]
[-2.7722 7.1841 15.4071]
…
[ 2.8899 -9.5252 24.7799]
[ 2.8352 -9.4917 24.8507]
[ 2.8318 -9.478 24.8437]]
These are points of the triangles.
point_1(xyz) of triangle_1
point_2(xyz) of triangle_1
point_3(xyz) of triangle_1
point_1(xyz) of triangle_2
point_2(xyz) of triangle_2
point_3(xyz) of triangle_2
・
・
Let’s reshape these data into the PLY format.
- point(vertex) data
- face data
Use “numpy.unique” to delete duplication.
vertices, vertex_indices = np.unique(point_list, return_inverse=True, axis=0)Unique point_list is stored in “vertices”, and index of these vertices are allocated to the points of triangles and stored as “vertex_indices”
print(len(vertices))
# 49714
print(vertices)
#[[-5.7769 16.6657  0.4585]
# [-5.7701 16.8729  0.5121]
# [-5.7679 16.8331  0.6828]
# ...

print(vertex_indices)
# [12173 12257 11565 ... 38652 38419 38407]
# delete the duplicates and allocated index of the vertices to points of the triangles
set each 3 point indices serves a list of points of triangles.
index_triangle = vertex_indices.reshape([-1, 3])
print(index_triangle)
[[12173 12257 11565]
[12173 11565 11472]
[12062 12173 11472]
…
[38875 38669 38652]
[38652 38669 38419]
[38652 38419 38407]]
(2)Write the data in .ply file
A simple ply file contains only (x, y, z) and quality.
As an example, let’s write a ply file of the dog.stl with the value same as y-value.
ply
format ascii 1.0
element vertex “number of points”
property float x
property float y
property float z
property float quality
element face “number of faces”
property list uchar int vertex_indices
end_header
(x, y, z) of point_1, quality
(x, y, z) of point_2, quality
・
・
3, index of triangle-1_point-1,index of triangle-1_point-2, index of triangle-1_point-3,
3, index of triangle-2_point-1,index of triangle-2_point-2, index of triangle-2_point-3,
・
・
・
Write these texts by Python Programming.
“numpy.concatenate” is used to Add quality data to the coordinate values,
import numpy as np
from stl import mesh

"""Extract point and face data from .stl file"""
file_name =('dog_test.ply')
dog_stl = mesh.Mesh.from_file('dog.stl')
points = dog_stl.points.reshape([-1, 3])
vertices, vertex_indices = np.unique(points, return_inverse=True, axis=0)
# delete duplicate and allocate index of the vertices to points
index_triangle = vertex_indices.reshape([-1, 3])
# index of the 3 points

"""write header"""
header = (
'ply\n\
format ascii 1.0\n\
element vertex {}\n\
property float x\n\
property float y\n\
property float z\n\
property float quality\n\
element face {}\n\
property list uchar int vertex_indices\n\
end_header\n').format(len(vertices),len(index_triangle)
)
# the number of the points and elements are substituted

with open(file_name, 'w') as f:
    f.write(header)

"""write text for point data"""
qualities = np.array([vertices[:, 1]]).T
# set y value as quality of the point and reshaped
vertices_text = np.concatenate([vertices, qualities], axis=1)
# add the quality to the (x, y, z) values of the points

with open(file_name, 'a') as f:
    np.savetxt(f, vertices_text, fmt='%.5f')
# use 'a' mode to add text.

"""write text for face data"""
first_indices = np.full([len(index_triangle), 1], 3)
face_txt =np.concatenate([first_indices, index_triangle], axis=1)
# write 3 for triangle before 3 indices of the points

with open(file_name, 'a') as f:
    np.savetxt(f, face_txt, fmt='%i')
# append the text of the faces
“dog_test.ply” is saved.
3 Open and Check the PLY file
Open “dog_test.ply” by text editor.
ply
format ascii 1.0
element vertex 49714
property float x
property float y
property float z
property float quality
element face 99424
property list uchar int vertex_indices
end_header
-5.77690 16.66570 0.45850 16.66570
-5.77010 16.87290 0.51210 16.87290
-5.76790 16.83310 0.68280 16.83310
・
・
3 12173 12257 11565
3 12173 11565 11472
3 12062 12173 11472
3 12062 11472 11382
3 12173 12062 12870
3 12173 12870 12997
・
・
・
Quality is the same as the y value.
Open this ply file in Meshlab.
Click the colorful rabbit icon in upper right area. Then “QualityMapperDialog” window is opened.
This is a dialog to control colormap for qualites.
Once click “Apply”, the color map is allocated to each vertex.
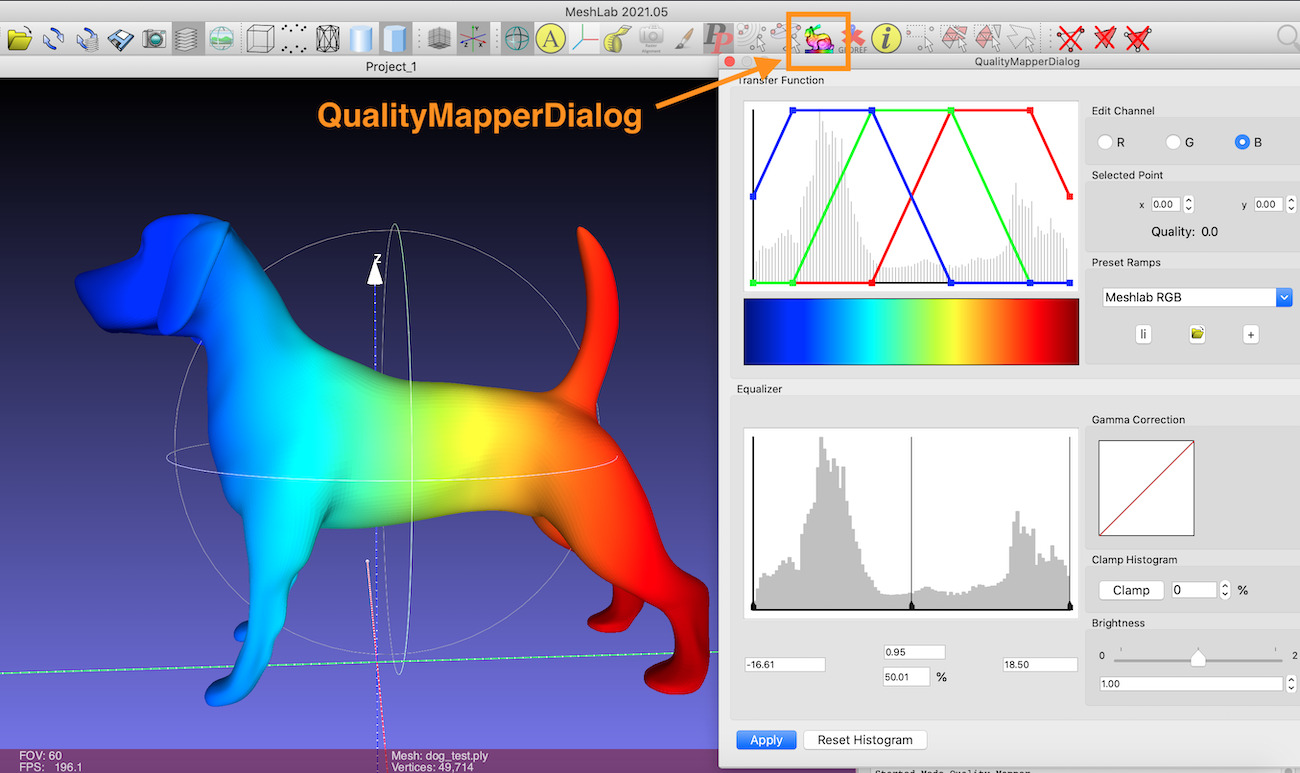
Along the Y-axis, the color changes from blue (small quality) to red (large quality).
You can choose a certain range of qualities.
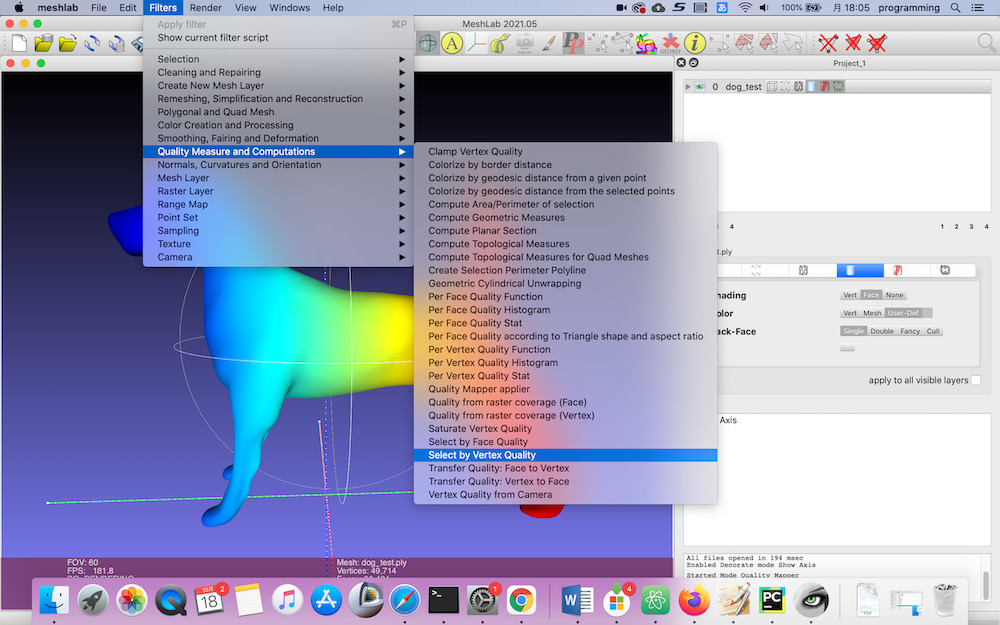
“Filters” ⇒ “Quality Measure and Computation” ⇒ “Select by Vertex Quality”
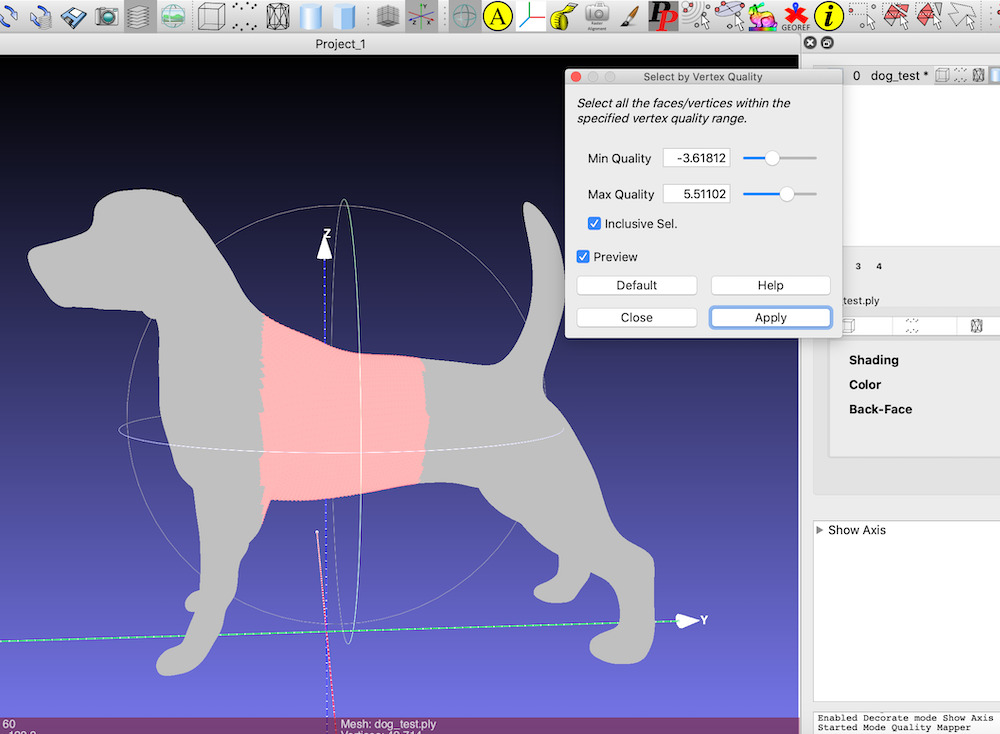
Click “Preview” and choose Quality.
Data Camp is the best online programming course to learn Python and Numpy for data analysis.
⬇ (External Link)